
I have deep industry experience in business, software, life sciences, bioinformatics, financial markets, and genetics. Current technical knowledge/skills includes statistical analysis, machine learning (supervised and unsupervised), deep learning, SQL, Tableau, and Big Data (Hadoop, Spark, AWS, Cassandra, Redshift). For examples of my projects please look at the menu on the left. The most recent projects are under “RECENT POSTS”. For a complete list of projects click on “Technical” which is below on the left under “CATEGORIES”.
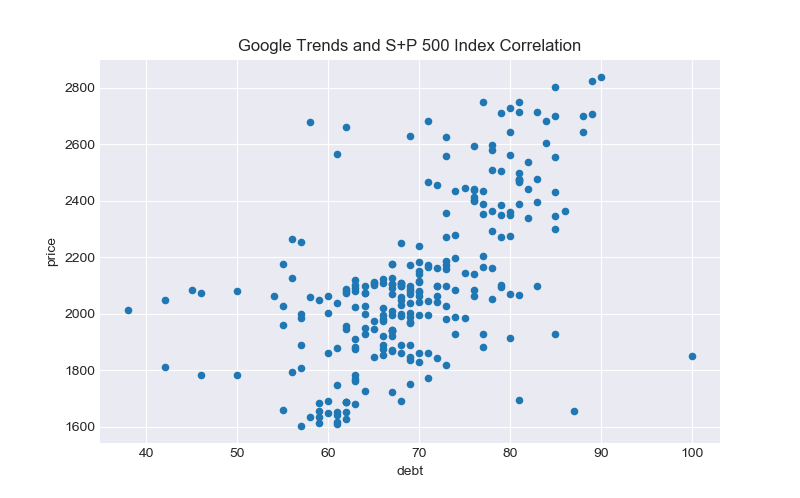 I am downloading data from Google Trends and merging it with historical S&P 500 index data looking for tradeable trends from April 2013 to April 2018. Correlation is promising (.58) and p-value was excellent at 4.5538 e-24 (VERY strong signal). I am working on creating a goal seeking algorithm that will yield specific signals to buy, sell or hold on a weekly basis (ergo sell on Friday, buy on Monday).

 A bike share provider in the United States wanted to uncover bike share usage patterns. Data (> 10 million rows) from Chicago, New York City, and Washington, DC were analyzed and appropriate descriptive statistics computed utilizing Python , ATOM (IDE), and JSON data formats. If you would like a copy of the .py file please